
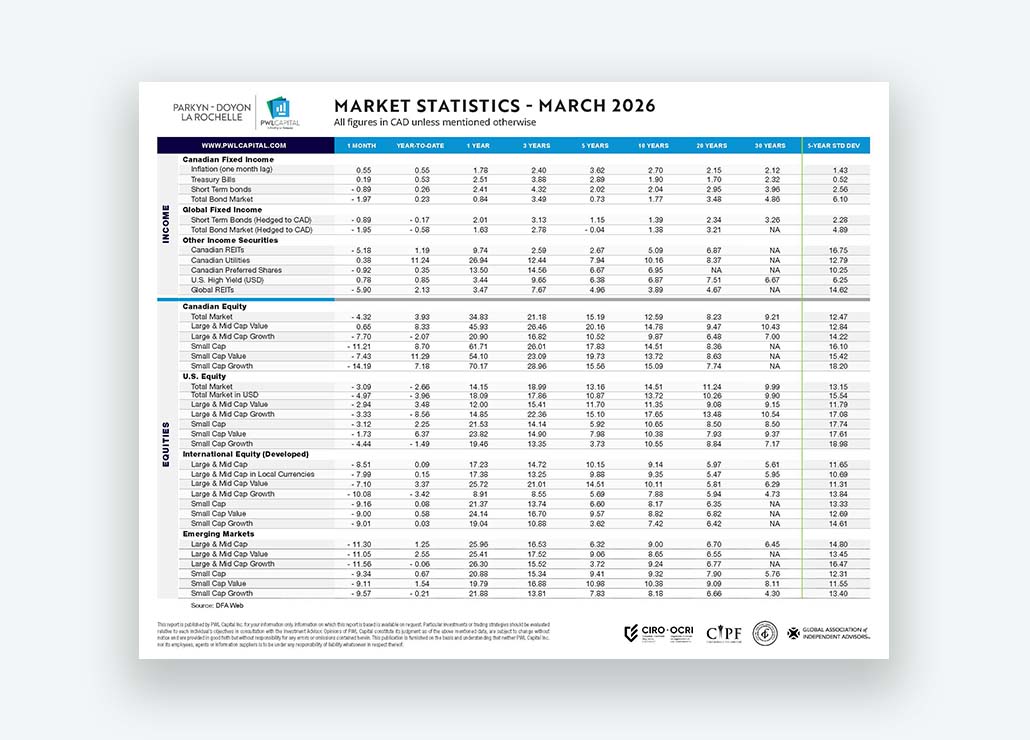


Market Statistics – Expanded View
All figures in CAD unless mentioned otherwise.
Income
Canadian Fixed Income
| 1 Month | YTD | 1 Year | 3 Years | 5 Years | 10 Years | 20 Years | 30 Years | 5 Year STD DEV | |
|---|---|---|---|---|---|---|---|---|---|
| Inflation (one month lag) | 0.55 | 0.55 | 1.78 | 2.40 | 3.62 | 2.70 | 2.15 | 2.12 | 1.43 |
| Treasury Bills | 0.19 | 0.53 | 2.51 | 3.88 | 2.89 | 1.90 | 1.70 | 2.32 | 0.52 |
| Short Term bonds | - 0.89 | 0.26 | 2.41 | 4.32 | 2.02 | 2.04 | 2.95 | 3.96 | 2.56 |
| Total Bond Market | - 1.97 | 0.23 | 0.84 | 3.49 | 0.73 | 1.77 | 3.48 | 4.86 | 6.10 |
Global Fixed Income
| 1 Month | YTD | 1 Year | 3 Years | 5 Years | 10 Years | 20 Years | 30 Years | 5 Year STD DEV | |
|---|---|---|---|---|---|---|---|---|---|
| Short Term Bonds (Hedged to CAD) | - 0.89 | - 0.17 | 2.01 | 3.13 | 1.15 | 1.39 | 2.34 | 3.26 | 2.28 |
| Total Bond Market (Hedged to CAD) | - 1.95 | - 0.58 | 1.63 | 2.78 | - 0.04 | 1.38 | 3.21 | NA | 4.89 |
Other Income Securities
| 1 Month | YTD | 1 Year | 3 Years | 5 Years | 10 Years | 20 Years | 30 Years | 5 Year STD DEV | |
|---|---|---|---|---|---|---|---|---|---|
| Canadian REITs | - 5.18 | 1.19 | 9.74 | 2.59 | 2.67 | 5.09 | 6.87 | NA | 16.75 |
| Canadian Utilities | 0.38 | 11.24 | 26.94 | 12.44 | 7.94 | 10.16 | 8.37 | NA | 12.79 |
| Canadian Preferred Shares | - 0.92 | 0.35 | 13.50 | 14.56 | 6.67 | 6.95 | NA | NA | 10.25 |
| U.S. High Yield | 0.78 | 0.85 | 3.44 | 9.65 | 6.38 | 6.87 | 7.51 | 6.67 | 6.25 |
| Global REITs | - 5.90 | 2.13 | 3.47 | 7.67 | 4.96 | 3.89 | 4.67 | NA | 14.62 |
Equities
Canadian Equity
| 1 Month | YTD | 1 Year | 3 Years | 5 Years | 10 Years | 20 Years | 30 Years | 5 Year STD DEV | |
|---|---|---|---|---|---|---|---|---|---|
| Total Market | - 4.32 | 3.93 | 34.83 | 21.18 | 15.19 | 12.59 | 8.23 | 9.21 | 12.47 |
| Large & Mid Cap Value | 0.65 | 8.33 | 45.93 | 26.46 | 20.16 | 14.78 | 9.47 | 10.43 | 12.84 |
| Large & Mid Cap Growth | - 7.70 | - 2.07 | 20.90 | 16.82 | 10.52 | 9.87 | 6.48 | 7.00 | 14.22 |
| Small Cap | - 11.21 | 8.70 | 61.71 | 26.01 | 17.83 | 14.51 | 8.36 | NA | 16.10 |
| Small Cap Value | - 7.43 | 11.29 | 54.10 | 23.09 | 19.73 | 13.72 | 8.63 | NA | 15.42 |
| Small Cap Growth | - 14.19 | 7.18 | 70.17 | 28.96 | 15.56 | 15.09 | 7.74 | NA | 18.20 |
U.S. Equity
| 1 Month | YTD | 1 Year | 3 Years | 5 Years | 10 Years | 20 Years | 30 Years | 5 Year STD DEV | |
|---|---|---|---|---|---|---|---|---|---|
| Total Market | - 3.09 | - 2.66 | 14.15 | 18.99 | 13.16 | 14.51 | 11.24 | 9.99 | 13.15 |
| Total Market in USD | - 4.97 | - 3.96 | 18.09 | 17.86 | 10.87 | 13.72 | 10.26 | 9.90 | 15.54 |
| Large & Mid Cap Value | - 2.94 | 3.48 | 12.00 | 15.41 | 11.70 | 11.35 | 9.08 | 9.15 | 11.79 |
| Large & Mid Cap Growth | - 3.33 | - 8.56 | 14.85 | 22.36 | 15.10 | 17.65 | 13.48 | 10.54 | 17.08 |
| Small Cap | - 3.12 | 2.25 | 21.53 | 14.14 | 5.92 | 10.65 | 8.50 | 8.50 | 17.74 |
| Small Cap Value | - 1.73 | 6.37 | 23.82 | 14.90 | 7.98 | 10.38 | 7.93 | 9.37 | 17.61 |
| Small Cap Growth | - 4.44 | - 1.49 | 19.46 | 13.35 | 3.73 | 10.55 | 8.84 | 7.17 | 18.98 |
International Equity (Developped)
| 1 Month | YTD | 1 Year | 3 Years | 5 Years | 10 Years | 20 Years | 30 Years | 5 Year STD DEV | |
|---|---|---|---|---|---|---|---|---|---|
| Large & Mid Cap | - 8.51 | 0.09 | 17.23 | 14.72 | 10.15 | 9.14 | 5.97 | 5.61 | 11.65 |
| Large & Mid Cap in Local Currencies | - 7.99 | 0.15 | 17.38 | 13.25 | 9.88 | 9.35 | 5.47 | 5.95 | 10.69 |
| Large & Mid Cap Value | - 7.10 | 3.37 | 25.72 | 21.01 | 14.51 | 10.11 | 5.81 | 6.29 | 11.31 |
| Large & Mid Cap Growth | - 10.08 | - 3.42 | 8.91 | 8.55 | 5.69 | 7.88 | 5.94 | 4.73 | 13.84 |
| Small Cap | - 9.16 | 0.08 | 21.37 | 13.74 | 6.60 | 8.17 | 6.35 | NA | 13.33 |
| Small Cap Value | - 9.00 | 0.58 | 24.14 | 16.70 | 9.57 | 8.82 | 6.82 | NA | 12.69 |
| Small Cap Growth | - 9.01 | 0.03 | 19.04 | 10.88 | 3.62 | 7.42 | 6.42 | NA | 14.61 |
Emerging Markets
| 1 Month | YTD | 1 Year | 3 Years | 5 Years | 10 Years | 20 Years | 30 Years | 5 Year STD DEV | |
|---|---|---|---|---|---|---|---|---|---|
| Large & Mid Cap | - 11.30 | 1.25 | 25.96 | 16.53 | 6.32 | 9.00 | 6.70 | 6.45 | 14.80 |
| Large & Mid Cap Value | - 11.05 | 2.55 | 25.41 | 17.52 | 9.06 | 8.65 | 6.55 | NA | 13.45 |
| Large & Mid Cap Growth | - 11.56 | - 0.06 | 26.30 | 15.52 | 3.72 | 9.24 | 6.77 | NA | 16.47 |
| Small Cap | - 9.34 | 0.67 | 20.88 | 15.34 | 9.41 | 9.32 | 7.90 | 5.76 | 12.31 |
| Small Cap Value | - 9.11 | 1.54 | 19.79 | 16.88 | 10.98 | 10.38 | 9.09 | 8.11 | 11.55 |
| Small Cap Growth | - 9.57 | - 0.21 | 21.88 | 13.81 | 7.83 | 8.18 | 6.66 | 4.30 | 13.40 |